The INTRODUCTION section which gives a little explanation about the stack. It contains seven cards, five of which describes one of the remaining section;
The PROBLEM section - one card where you can write background information about a decision making problem;
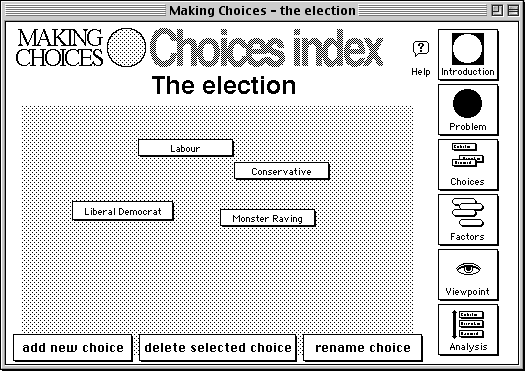
The CHOICES section - one card where you create the (mutually exclusive) choices. The choices here can be arranged arbitrarily on the screen - the purpose is identification of the choices rather than comparison or valuation. By clicking on the selected choice, you can go to a card for that choice, where you can write a brief description and see a summary of its value in relation to each factor;

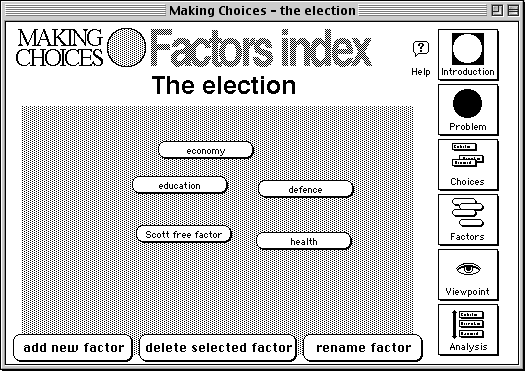
The FACTORS section - one card where you define the factors against which the choices will be ranked. As with the Choices card, factors here can be arranged arbitrarily on the screen - the purpose is identification of the factors. By clicking on the selected factor, you can go to a card for that factor, where you can write a brief description and most importantly, begin to give values to the choices by dragging them on screen to new positions. Wherever you drag them, the computer will rearrange the choices to reflect their ranks - they cannot be left in 'absolute' positions;

The VIEWPOINT section - one card where you consider the importance of each factor from a particular viewpoint. You can play the role of different groups or individuals here and see how your ranking of factors might affect a decision.
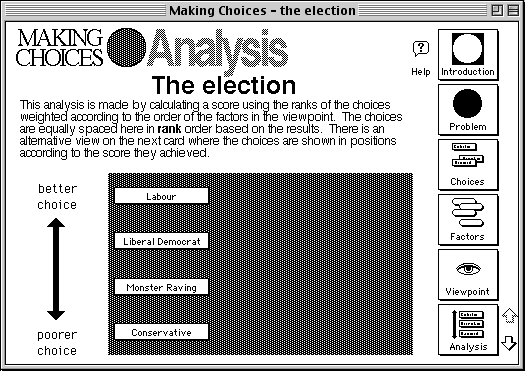
The ANALYSIS section - two cards where the computer combines the results of the factors and viewpoints and ranks the choices. The second card shows how the choices might be seen if values are assigned on an Interval scale based on the calculations outcome. We could not agree whether it was reasonable to do this, but in many cases it indicates whether choices really are close - should we be showing the choices on an Interval scale resulting from calculations on multiple Ordinal scale data?
